Details
-
Type:
Bug
-
Status: Resolved
-
Priority:
Major
-
Resolution: Fixed
-
Affects Version/s: 3.10.0
-
Fix Version/s: 3.11.0
-
Component/s: app.editor
-
Labels:None
-
Target Version:
-
Sprint:Jul 25 - Aug 12, 2016
Description
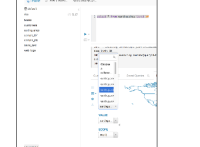
Run "select * from earthquakes limit 50" and then select "Gradient map" as the chart type. When you try to select a column for the X - or Y-axis, the column names are only partially visible (at least in Safari). I later found that this also applied to column selection for scatter plots.
